
📊 How to Analyze Stocks
By StockTalkAI · March 25, 2025 · 10 minute read
This content may include information about products, features, and/or services that StockTalkAI does not provide and is intended to be educational in nature.
Table of Contents
Analyzing Stocks
Stock analysis helps investors make informed decisions by understanding a company’s history and prospects. It aids in identifying both good opportunities and potential risks.
What sets StockTalkAI apart from other trading assistant apps is our unique approach: we don’t just analyze stock prices and historical trends — we contextualize them with key financial metrics reported quarterly and annually to the SEC. If a company’s revenue is consistently rising quarter over quarter, it’s a strong signal that its share price is likely to follow.
"The stock market is filled with individuals who know the price of everything, but the value of nothing."
— Philip Fisher
Identifying Buying Opportunities
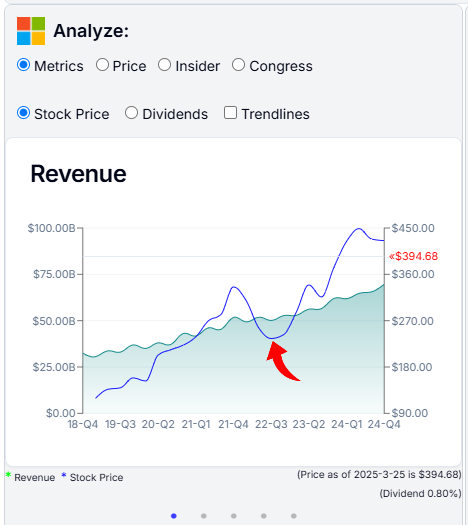
For example, Microsoft’s revenue shows steady growth, as illustrated by the green chart, while its stock price displays more uneven movement during the same period as illustrated by the blue line—creating clear opportunities for buying and/or selling. The unusual drop in price in Q3 2022 is a good example of a buying opportunity.
Identifying Selling Opportunities
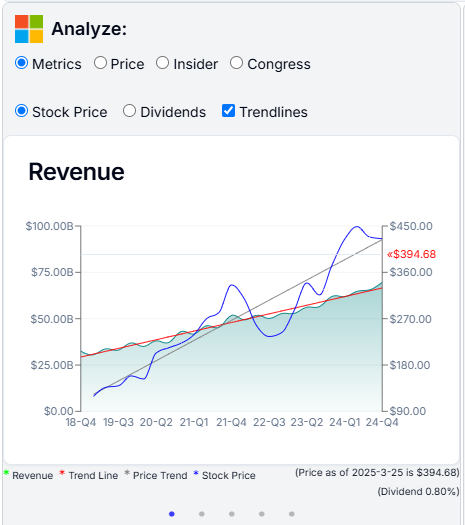
Our AI calculates both the trendline of key financial metrics and the trendline of the stock price. A trendline is a visual representation of the general direction or pattern of data over time. By overlaying these lines, you can easily spot overvaluation or undervaluation. If the two lines are moving appart, the stock is likely overvalued. If they are moving together, the stock is likely undervalued.
In Microsoft’s case, by Q1 2025, the price trendline (gray line) is moving appart form the Revenue trendline (red line), so the share price appears to be overvalued relative to its underlying metrics.
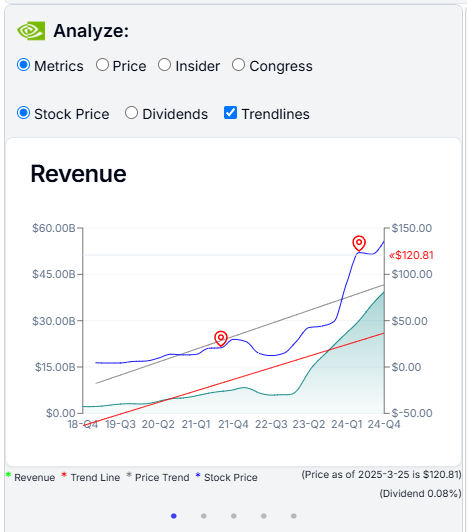
When comparing Microsoft to Nvidia, it's clear that Nvidia's price growth (gray line) has been moving roughly in parallel with its revenue trendline (red line), indicating a more favorable and justified valuation for Nvidia vs Microsoft.
Understanding Financial Statements
One of the main reasons we built this app was to let AI handle the heavy lifting of analyzing and visualizing quarterly and annual financial statements for all companies. Let’s face it — reading these reports isn’t exactly thrilling. They’re often packed with dense tables, accounting jargon, and endless numbers that seem almost designed to put you off. But now, with the help of AI, we can break them down into clear, easy-to-understand charts and summaries — so you get the insights without the headache. Check the SEC site for yourself to see what we mean.
"The investor’s chief problem – and even his worst enemy – is likely to be himself. But diligent analysis of financial statements can protect him from himself."
— Benjamin Graham
We will show you the following key metrics:
- Income: We show Revenue, Net Income, and Gross Profit.
- Expenses: We show a comprehensive Cost of Revenue.
- Earnings Per Share: Showing how much money a company makes per share of stock. For example you can clearly see the impact of the pandemic on Starbucks earnings per share in Q2 2020.
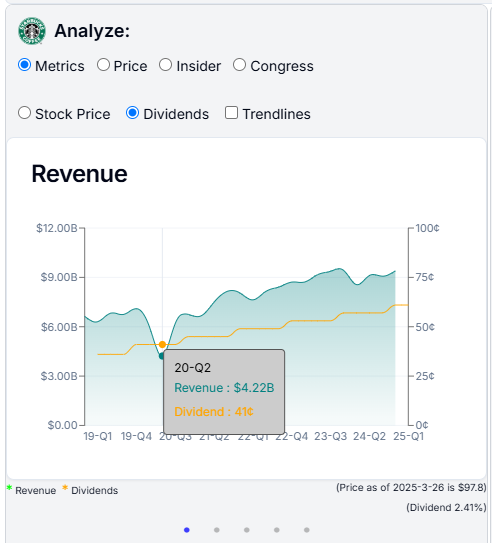
- Dividends: We show 5-6 years of dividend history. Look for a consistent or increasing dividend payout. Starbucks is a good example of a company with a strong dividend history. They continued to pay dividends even during the pandemic.
Understanding Insider and Congress data
Our platform includes insider trading and Congressional trading data to give you a deeper edge in stock analysis. By tracking when company insiders—such as executives and directors—buy or sell shares, you can spot potential confidence or concern about the company’s future. Additionally, monitoring trades made by members of Congress, who often have access to timely information, can provide early indicators of market-moving trends. Use these insights alongside traditional analysis to identify possible upward or downward movements in stock symbols and make more informed investment decisions.
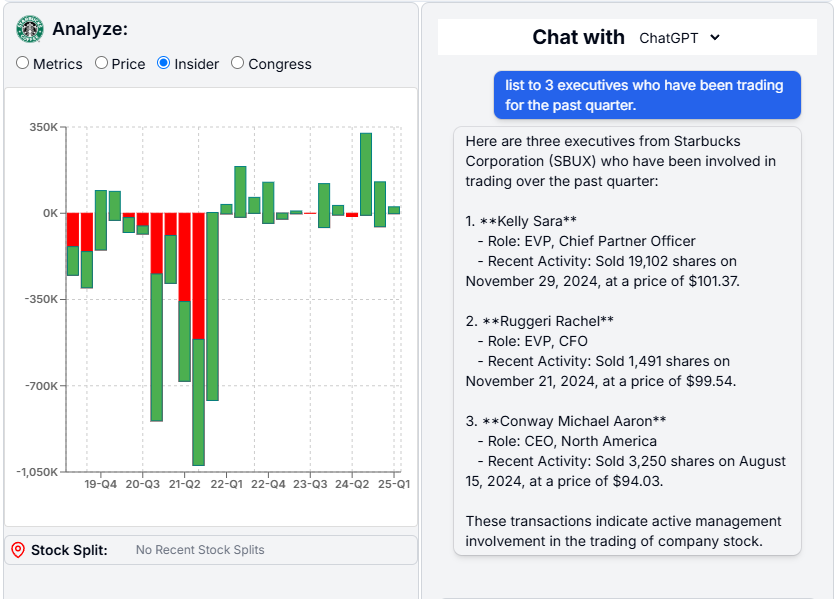
- Insider: Insider trading data can be complex, especially since many purchases are made through options—contracts that give the right, but not the obligation, to buy or sell a stock at a set price in the future. These transactions don’t always reflect straightforward buying or selling. To make this data more actionable, we use AI and business intelligence (BI) tools to aggregate and interpret insider trades, highlighting key trends. A predominantly green bar chart signals more insider purchasing—often a sign of confidence in the company—while a red chart indicates more selling, which may suggest caution. In case of Starbucks below, we can see that the executives sentiment was very negative during pandemic, but is now positive.
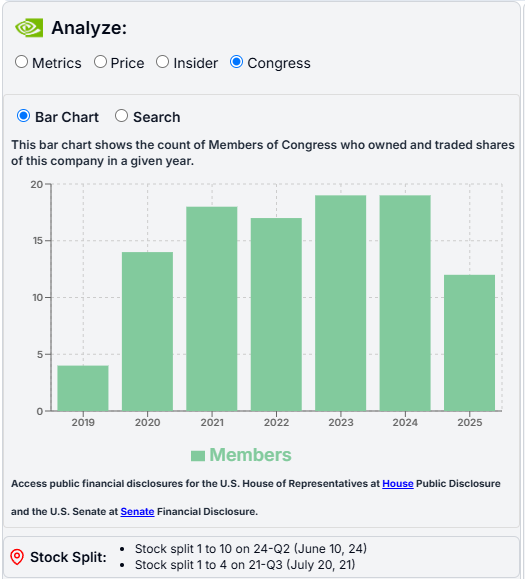
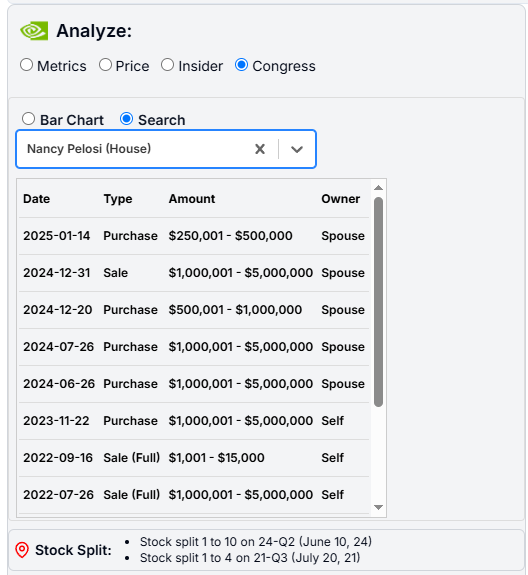
You could ask AI to list the top company executives who have been buying or selling shares. - Congress: While we don't view this as a strong indicator, due to the growing popularity of this feature, we've included it in our application. Nancy Pelosi remains one of the most followed figures in this context. You can view how many members of Congress have traded a particular stock and search for them by name.
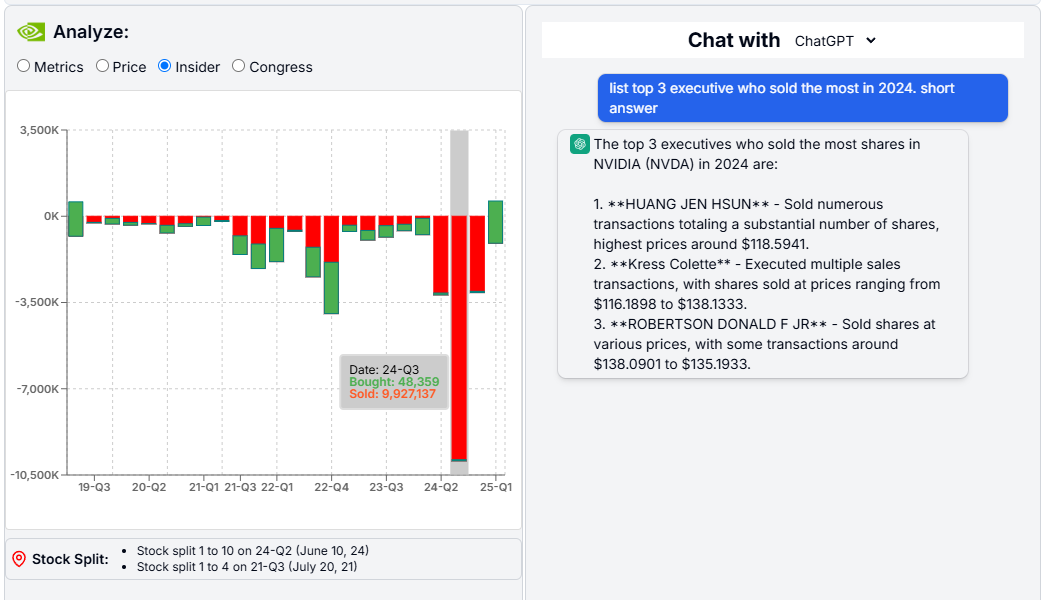
Nvidia's insider activity is a strong example of how revealing such data can be. With the help of AI, it's clear that executives have been engaging in significant profit-taking — a potential signal that they believe the stock has reached its peak.
"There’s insider trading, and then there’s legal insider trading — it’s called Congress."
— Unattributed Internet Wisdom
Four Ways to Analyze a Stock
Our charts seamlessly combine four powerful analytical techniques, allowing you to absorb complex information at a glance. These methods can help you make more informed investment decisions, whether you’re a seasoned trader or just starting out.
1. Technical Analysis
Technical analysis is a method of evaluating stocks based on price movement and trading volume, focusing on supply and demand dynamics. It assumes that all necessary information is already reflected in a stock's price and charts.
Core beliefs of technical analysis include:
- Stock prices move in trends.
- History tends to repeat itself.
- Past price patterns can help predict future movements.
- Price reflects all relevant market information.
- It does not consider a stock’s intrinsic value.
A key aspect of technical analysis is identifying trends. Uptrends consist of higher highs and higher lows, while downtrends feature lower lows and lower highs. Traders use trend indicators to assess these movements.
Technical analysis also utilizes two types of indicators:
- Leading Indicators: Predict upcoming trends.
- Lagging Indicators: Confirm trends after they begin or end.
These indicators analyze data like price movement, volume, opening and closing prices, and momentum.
While technical analysis offers objective, data-driven insights—particularly useful for day traders seeking short-term gains—it also has limitations. It can produce false signals in volatile markets and overlooks fundamental factors such as company health and broader economic indicators.
2. Qualitative Analysis
Qualitative stock analysis focuses on the characteristics of the company itself—beyond the numbers. It helps determine whether the business behind the stock is fundamentally strong by evaluating non-quantifiable factors such as leadership quality, business model, and market position.
Key qualitative factors to consider include: (Just chat with AI to learn about these factors)
- Competitive Advantage: Does the company have a unique edge that makes it stand out? This could include proprietary technology, exclusive patents, strong branding, or an extensive distribution network—all of which can contribute to long-term success.
- Business Model: A company’s business model reflects how it delivers value to customers and generates revenue. Assess its products, services, target audience, and brand identity to understand its overall strategy.
- Strong Leadership: A solid business can still fail under poor leadership. Investigate the background and track record of the CEO and executive team to gauge their experience, vision, and ability to execute.
- Industry Trends: Understanding the health and trajectory of the industry is important. While growing industries can present new opportunities, even companies in declining sectors can thrive if they are well-positioned. The reverse is also true.
3. Quantitative Analysis
Quantitative analysis involves examining numerical data to evaluate a company's financial performance and predict future stock behavior. It shares similarities with technical analysis but focuses more on company fundamentals using measurable data points.
This method typically includes metrics such as:
- Revenue: Total income generated from business operations.
- P/E Ratio (Price-to-Earnings): A valuation metric comparing a company’s share price to its earnings per share.
- EPS (Earnings Per Share): The portion of a company’s profit allocated to each outstanding share of stock.
Quantitative analysis often uses statistical models and mathematical techniques to identify patterns and assess investment potential. Since the financial data is publicly available, it offers a consistent and objective foundation for decision-making.
However, it comes with limitations. The volume of data can be overwhelming, and identified patterns may not always persist. Market conditions change, and models built on past data can sometimes lead to inaccurate predictions.
4. Fundamental Analysis
Fundamental analysis focuses on evaluating a company’s financial health and estimating its intrinsic value to determine whether a stock is overvalued or undervalued. This long-term investment approach uses financial statements, ratios, and economic indicators to assess a company’s overall performance and growth potential.
Key tools and metrics used in fundamental analysis include:
- EPS (Earnings Per Share): Indicates how much profit is allocated to each outstanding share. A higher EPS generally reflects greater profitability.
- Revenue: The total income a company generates from its operations before expenses. It's a top-line indicator of growth and demand for products or services.
- P/E Ratio (Price-to-Earnings): Compares a company’s stock price to its earnings per share. A lower P/E might indicate undervaluation, while a higher P/E could suggest strong growth expectations—or overvaluation.
- PEG Ratio (Price/Earnings to Growth): Adjusts the P/E ratio by factoring in earnings growth. A PEG below 1 may indicate the stock is undervalued relative to its growth rate.
- P/S Ratio (Price-to-Sales): Measures the company’s value relative to its revenue. A lower P/S may suggest better value, especially in companies not yet profitable.
- Debt-to-Equity Ratio: Shows how much debt a company uses to finance its operations relative to shareholder equity. A high ratio might signal financial risk.
- Debt-to-EBITDA Ratio: Assesses a company’s ability to repay debt by comparing total debt to its earnings before interest, taxes, depreciation, and amortization. Lower ratios suggest stronger debt management.
- Dividend Yield: Expresses the annual dividend as a percentage of the stock price. It’s a key metric for income-focused investors seeking regular returns.
- P/B Ratio (Price-to-Book): Compares the market value of a stock to its book value (assets minus liabilities). A low P/B ratio may indicate undervaluation.
Investors use these tools to gain insight into a company's financial stability, growth potential, and fair market value. Unlike technical analysis, which focuses on short-term price movements, fundamental analysis is better suited for long-term investment decisions.
Company Reports and Projections
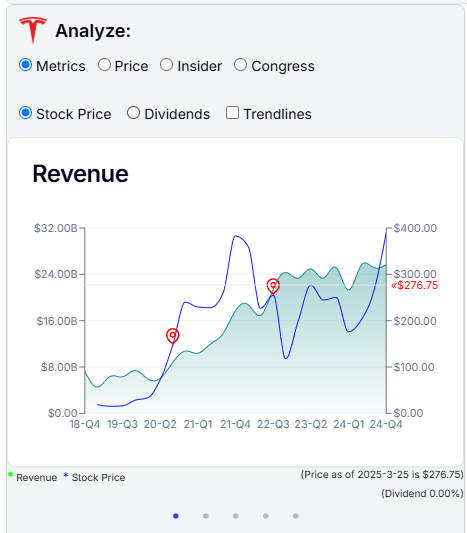
Quarterly/annual reports offer insights on revenue and EPS projections. Market reactions to these can move stock prices. We show key metrics for the selected company for the past 5 years. The green chart represents the metric (in this case Revenue) and the blue chart represents the stock price. The correlation between the two charts can be used to make investment decisions.
Professional Analysis
Wall Street analysts provide ratings, forecasts, and comparisons. Useful but not always accurate.Despite their expertise, the majority of professional investors underperform the market over time. Studies like the SPIVA report consistently show that over 80% of actively managed U.S. equity funds fail to beat the S&P 500 over a 10-year period. Factors such as high fees, market efficiency, and behavioral biases contribute to this underperformance.
Quantitative vs Qualitative Analysis
| Quantitative | Qualitative |
|---|---|
| Uses numerical data for predictions | Focuses on business characteristics |
| Data-heavy, often complex | Evaluates leadership, brand, and trends |
| Objective analysis | Subjective insights |
Pros and Cons of Doing Your Own Stock Analysis
Our app is built to help minimize the challenges listed below, making self-analysis easier and more effective.
Pros
- Eliminates the need for paid experts
- Gain valuable insights while learning
- Full control over your investment decisions
- Access to a wide range of analytical tools
Cons
- Time-intensive process
- Can be complex and overwhelming
- Steep learning curve and continuous effort required
- Higher risk of errors without proper tools
Disclaimer: This content is for educational purposes only and does not constitute financial advice.
StockTalkAI
StockTalkAI: Unlock a New Market Perspective.